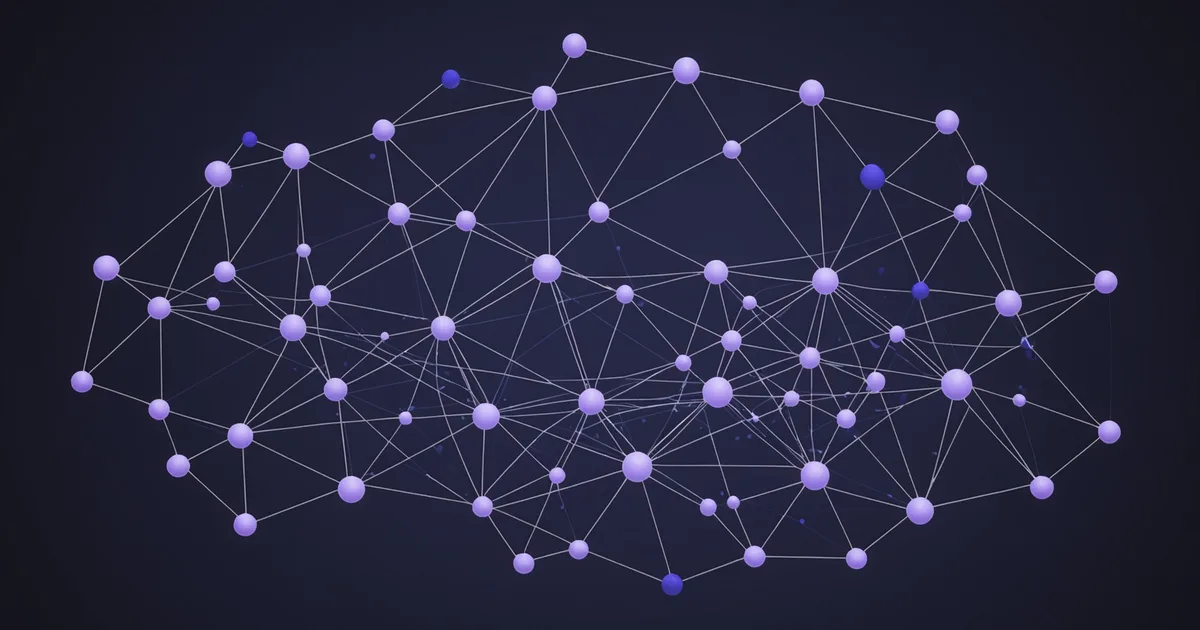
The appeal of transaction graph analysis is straightforward: fraud rings look clean at the individual account level. Each account has valid credentials, plausible transaction history, and no single red flag that would trigger a conventional score. But viewed as a network, the accounts are all connected through shared devices, shared receiving addresses, shared phone numbers, or shared funding instruments in patterns that no legitimate customer cluster would show.
Graph-based features can catch what individual-account scoring misses. They can also introduce query latency and operational complexity that makes them difficult to deploy in a real-time scoring context. The practical question is not whether to use graph features, but how to scope them so that the detection benefit exceeds the operational cost.
What a Transaction Graph Actually Contains
In the context of a digital-finance platform, the transaction graph is a data structure where nodes represent entities and edges represent relationships. Entities include accounts, payment instruments (cards, bank accounts, wallet addresses), devices, IP addresses, email addresses, phone numbers, and physical addresses. Relationships include "account used this device," "account sent funds to this account," "two accounts share this payment instrument," and so on.
The key insight is that fraud operations create dense, unnatural clusters in this graph because they share infrastructure. A legitimate customer network looks sparse and organic: a person has one or two devices, their own payment instruments, and P2P transfers to a handful of known contacts. A fraud ring sharing device pools, drop addresses, and mule accounts looks like a densely connected subgraph where the connection density and the structural position of shared nodes are both anomalous.
Graph feature extraction is the process of taking that structural information and producing numerical features that can be fed into a conventional scoring model. You are not running a separate graph model in real time; you are pre-computing graph-derived features and using them as inputs to a model that scores each transaction individually at query time.
Depth vs Latency: The Core Tradeoff
Graph query depth refers to how many hops away from the target account you traverse when computing graph features. A 1-hop query answers: what do we know about entities directly connected to this account? A 2-hop query answers: what do we know about entities connected to entities connected to this account? A 3-hop query goes one level further.
The detection value of deeper traversals is real. Fraud rings use isolation layers: a mule account that receives funds is connected to the fraud operation through one or two intermediary accounts specifically to create graph distance from the operation itself. At 1-hop depth, the mule account may look clean because its direct connections are all accounts it has transacted with normally. At 3-hop depth, those same connections resolve to a cluster of accounts with shared infrastructure and high fraud density.
The problem is that graph query latency scales non-linearly with depth. A 1-hop traversal on a well-indexed graph is fast: tens of milliseconds at scale. A 3-hop traversal on the same graph, visiting potentially millions of connected nodes across three degrees of separation, can take hundreds of milliseconds to seconds, which is incompatible with real-time scoring at checkout.
The practical resolution is to decouple graph feature computation from real-time scoring. Pre-compute graph features on a rolling basis (every few minutes, or on a change-triggered event basis) and store the output as a feature cache. The real-time scoring query reads from the cache rather than executing a live graph traversal. This adds a small lag between graph state changes and feature value updates, but it makes graph-derived features compatible with sub-100ms scoring latency.
The Feature Set That Matters Most in Practice
Not all graph features are equally valuable for fraud detection, and computing a large feature set from a deep graph traversal incurs real engineering cost. The features that consistently provide the most lift in fraud ring detection, based on what we built and tested during Birdai's development, cluster around four concepts.
Connected fraud density is the single most useful graph feature in most contexts. For a target account, compute the fraction of accounts within N hops that have a confirmed fraud label (from your labeled historical data). A new account that is connected through two degrees to a cluster of fraud-labeled accounts has a very different risk profile than a new account whose graph neighborhood shows clean history. This feature requires good historical fraud labels, which circles back to the attribution quality problem discussed in the chargebacks post.
Shared infrastructure centrality measures whether any node in the target account's immediate neighborhood (1-2 hops) is a high-centrality node shared by many other accounts. A device shared across 30 accounts, a phone number used to register 15 accounts in the same week, a bank account that has received transfers from a large number of distinct accounts in a short window: these are structural anomalies that appear naturally in fraud rings and almost never in legitimate customer networks. High-centrality shared infrastructure is the signature of infrastructure reuse, which is the operational constraint that most fraud operations cannot fully escape.
Graph neighborhood age distribution captures whether the accounts connected to the target were created in an unnaturally tight time window. Legitimate account networks grow organically over time. Fraud ring creation events often produce batches of accounts created within days of each other because the ring operator is setting up multiple accounts simultaneously. If 80% of the accounts within 2 hops of the target were created in the same 14-day window, that is structurally different from a neighborhood where accounts have a spread of creation dates over 18 months.
Transfer circuit detection flags the presence of circular fund flows in the account's transaction history or neighborhood. Money that flows A to B to C to A in short sequences is a strong indicator of layering activity, where funds are being moved through multiple accounts to create apparent transaction history before extraction. This is distinct from normal P2P activity where transfers are directional and non-circular.
Graph Feature Engineering Is Not Symmetric
One nuance worth flagging for teams new to graph features: the predictive signal is not symmetric across different relationship types. Some edge types carry much more signal than others, and building a feature from every edge type in your graph dilutes the signal with noise rather than improving it.
Shared device identity is typically a high-signal edge: two accounts sharing the same device is rare in legitimate usage and common in fraud ring operation. Shared IP address is lower signal: many accounts sharing the same IP is common in household and office environments and does not reliably indicate fraud ring behavior without additional context. Shared physical address is intermediate: legitimate for family accounts, suspicious if combined with other indicators like account creation timing.
Building graph features from high-signal edge types first, then adding lower-signal types only if they provide incremental lift in your validation set, is more practical than trying to incorporate every relationship type from the start. Each additional edge type you include in your graph traversal adds query complexity and maintenance overhead. The marginal benefit should exceed that cost.
Avoiding Over-Reliance on Graph Features
Graph features are powerful for detecting connected fraud rings, but they are not useful for all fraud types. First-time fraudsters who have not yet built a detectable network, compromised-account fraud where the account has a clean legitimate history, and authorized-push-payment scams where the fraudster's account may be purpose-built and isolated: none of these are reliably detected by graph features because the graph neighborhood does not yet reflect the fraudulent activity.
We are not saying graph features are a complete solution. They are one feature class in a broader feature set, and they are most valuable in proportion to the share of your fraud that involves organized rings using shared infrastructure. If your fraud mix is dominated by individual account takeovers with no connection to other compromised accounts, graph features will add minimal lift. If you are seeing patterns that suggest ring activity, such as coordinated bursts of account creation followed by similar transaction patterns across multiple accounts, graph features should be a high-priority addition to your scoring feature set.
The operational reality is that graph feature infrastructure requires real investment: a graph database or graph-indexed data store, an ingestion pipeline that keeps the graph current, a feature pre-computation job that runs at the frequency you need, and a caching layer that serves the features at query time. That investment is worth making when ring fraud is a material part of your loss picture. For platforms where fraud is primarily individual-account compromise, that investment is likely better directed elsewhere.